AyeTides XL shows currents as well as tides. The two station types are distinct, though - tide stations don't show currents, and currents stations don't show tides!
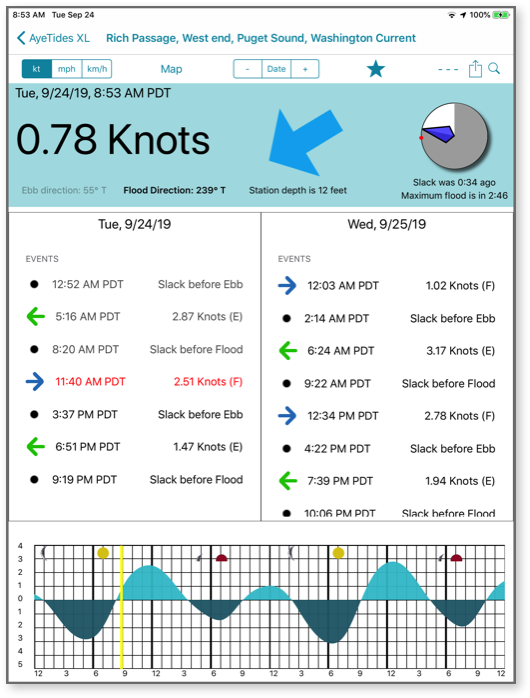
This view is crammed with data. You can see the direction of the current, the depth of the station, the times when the next flood or ebb is occurring, the time of the slack, the times of astronomical events, and more!
Remember the rule! Red, right, returning, in the direction of the flood.